
Have you ever waited two full business days for a software tool to be set up, even though the actual work took less than two hours?
When handoffs between departments are unverified, invisible waiting periods pile up. is the discipline of mapping, analyzing, and transforming these end-to-end chains of events to consistently deliver value to the customer.
To see how BPM works in practice, let’s walk through a hypothetical scenario of a project-management SaaS company as it fixes its customer onboarding process. Here, customer onboarding is the specific being managed, and BPM is the structured framework used to improve it.
flowchart TD
    ID["1. Process Identification"] --> D["2. Process Discovery"]
    D --> A["3. Process Analysis"]
    A <--> R["4. Process Redesign"]
    R --> I["5. Process Implementation"]
    I --> M["6. Process Monitoring"]
    M --> D
1. Process Identification: Selecting the Workflow and Assigning Ownership
Improving operational starts with process identification—selecting a target process from the company’s broader and setting operational boundaries.
In our hypothetical SaaS company, new clients submit spreadsheets containing 50+ project tasks to be imported into their workspace. When client complaints about setup delays mounted, the company selected customer onboarding for investigation. Onboarding sits directly between Sales (which closes the deal) and Ongoing Support (which assists the customer long-term).
The company initially assumed onboarding ended the moment the technical specialist imported the spreadsheet. Stopping there created a blind spot: if tasks were assigned to ambiguous names, the import was technically complete, but the customer still couldn’t use the workspace.
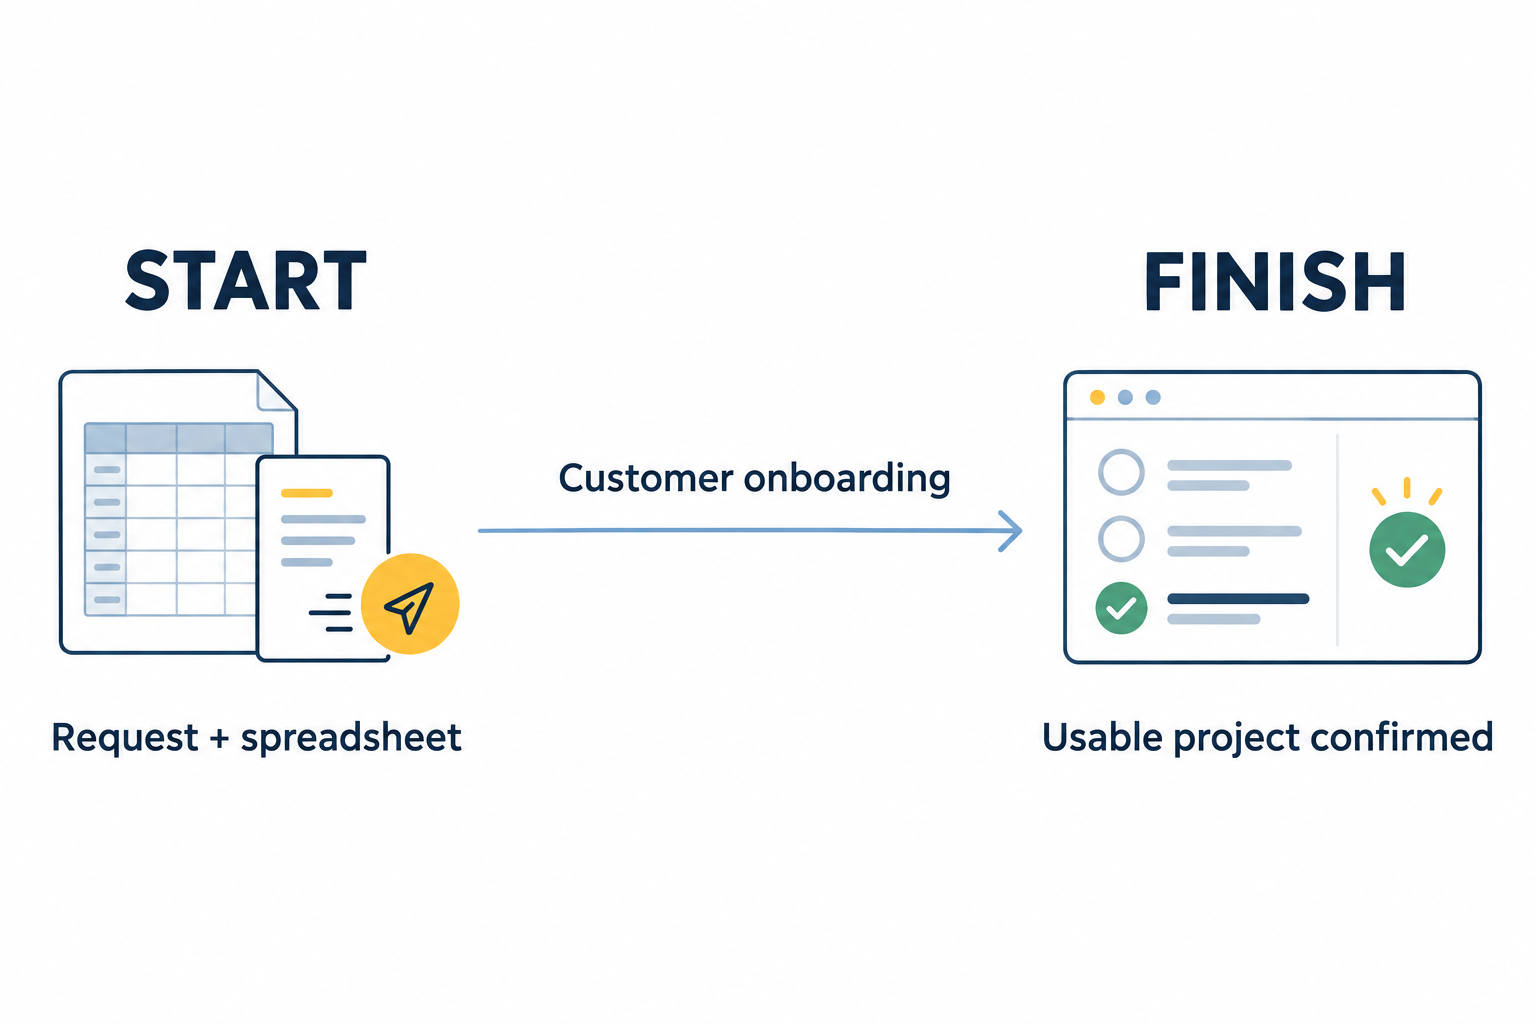
To manage the workflow, the team established three foundational rules:
-
Defined Scope: Onboarding starts when a client submits a setup request and spreadsheet, and ends only when the client confirms they can successfully update a task in a working project.
-
Appointed a : Because onboarding crosses two departments—Customer Success and Technical Implementation—the Customer Success Lead was named the process owner. Without a single accountable owner, individual departments optimize their own micro-tasks while nobody takes responsibility for total customer wait time.
-
Target Metrics: The team set a primary performance goal: reduce total to an average target of 10 business hours or fewer, while keeping post-import setup errors low.
2. Process Discovery: Mapping How Work Really Happens
To uncover operational reality—the phase—the interviewed team members, checked audit logs, and shadowed handoffs between Customer Success and Implementation Specialists to build an accurate .
Discovery revealed a recurring loop during the departmental handoff:
flowchart TD
    A["Customer submits request & spreadsheet"] --> B["Customer Success forwards details"]
    B -->|Waits in specialist queue| C["Specialist checks information"]
    C --> D{"Information sufficient?"}
    D -->|No| E["Customer Success requests clarification"]
    E --> F["Customer supplies clarification"]
    F -->|Rejoins specialist queue| C
    D -->|Yes| G["Specialist configures project & imports tasks"]
    G --> H["Customer checks setup & receives walkthrough"]
    H --> I["Task updated & completion confirmed"]
BPM draws on : examining how departments interact to understand the performance of the whole process. Customer Success forwarded spreadsheets without checking if task assignees (like “Alex”) matched confirmed user accounts. The Implementation Specialist discovered these ambiguous details only after the request sat in their queue. Resolving missing details required sending a query back to the customer, and once answered, the request went straight to the back of the specialist’s queue for a second wait.
3. Process Analysis: Quantifying the Waste
With the as-is model mapped, the analyst evaluated historical performance data during to determine which delays justified changing the workflow.
An audit of 20 typical onboarding requests revealed a stark imbalance between active work time and idle waiting time:
- Waiting for initial specialist review
- 2 hours
- Delay before Customer Success relays the question
- 3 hours
- Waiting for the customer’s reply
- 3 hours
- Second wait in the specialist queue
- 6 hours
The data yielded two critical insights:
-
The Primary Issue is Idle Time: Out of a 16-hour cycle time, 14 hours (87.5%) were spent sitting idle in queues or email chains.
-
Relays and Re-Queuing Drive Delays: Relaying questions (3 hours) plus the secondary queue wait (6 hours) accounted for 9 out of the 14 waiting hours.
Trying to speed up data import execution itself would yield negligible results because the vast majority of the delay occurred before technical setup even began. The analysis pointed to a clear priority: avoid the secondary specialist queue.
4. Process Redesign: Designing the “To-Be” Solution
During , the team formulated improvements and captured them in a .
Rather than attempting to fix missing details after requests reach the specialist’s queue, the team proposed moving verification upstream. Customer Success would perform an expanded check using a standardized checklist before forwarding the file.
Because each spreadsheet contains over 50 tasks with team-wide assignees, reps must match ambiguous names (like “Alex”) against account invite emails and workspace roles. Customer Success spends about 75 minutes on this verification. However, after accounting for 15 minutes saved by eliminating repeated specialist reviews, the team estimates a net increase of 60 minutes of employee labor per request.
flowchart TD
    A["Customer submits request & spreadsheet"] --> B["Customer Success verifies details via checklist"]
    B --> C{"Information sufficient?"}
    C -->|No| D["Customer Success clarifies details with customer"]
    D --> B
    C -->|Yes| E["Customer Success forwards checked details"]
    E -->|Waits in specialist queue| F["Specialist configures project & imports tasks"]
    F --> G["Customer checks setup & receives walkthrough"]
    G --> H["Task updated & completion confirmed"]
Evaluating the Tradeoffs: As-Is vs. To-Be
Redesign options involve tradeoffs between speed, cost, quality, and effort.
| Metric per Request | Current Process (“As-Is”) | Proposed Process (“To-Be”) | Net Impact |
|---|---|---|---|
| Active Work Time | 2 hours | 3 hours | Estimated net increase of +1 hour for upfront verification |
| Total Waiting Time | 14 hours | 5 hours | -9 hours of relay & secondary queue wait eliminated |
| Total Cycle Time | 16 business hours | 8 business hours | 50% estimated reduction in overall turnaround time |
While Customer Success spends extra time verifying accounts, avoiding the 9-hour relay and repeat queue wait aims to cut overall estimated cycle time in half.
5. Process Implementation: Executing Organizational & Technical Change
A process model on paper doesn’t change business outcomes on its own. The phase turns the “to-be” design into active daily practice through two pillars:
-
: Process changes disrupt established routines. The process owner must train Customer Success on the new checklist, explain why early verification matters, and guide staff through the transition.
-
& Infrastructure: Updating software tools to support the new workflow. The company added mandatory checklist fields directly into their shared workspace, preventing reps from handing off a setup task until all account matches were confirmed.
Note on Automation: Automating a flawed sequence simply speeds up inefficiency. The team corrected the handoff order first, then configured software to enforce the new rules.
6. Process Monitoring: Tracking Results and Testing Conformance
Once the redesigned workflow goes live, begins. The process owner collects operational data to evaluate two key areas:
-
: Are team members actually following the agreed procedure?
-
Performance: Is the process meeting its targets for speed, effort, and quality?
Pilot Results Across 20 Requests
The company tested the redesigned process on a pilot batch of 20 comparable onboarding requests:
| Performance Metric | Pre-Change Baseline | Pilot Results | Operational Finding |
|---|---|---|---|
| Average Cycle Time | 16 business hours | 9 business hours | Met the 10-hour average target; 18 of 20 requests finished under 10 hrs. |
| Total Waiting Time | 14 business hours | 6 business hours | Secondary queue wait eliminated. |
| Setups Needing Correction | 2 out of 20 | 1 out of 20 | Fewer setup corrections in this pilot batch. |
| Staff Labor Effort | 90 minutes | 150 minutes | Net paid employee labor increased by 60 minutes. |
Note on Labor Effort vs. Active Work Time: “Staff Labor Effort” (150 minutes) measures paid employee time. Total “Active Work Time” (3 hours) includes an additional 30 minutes of independent customer verification (e.g., verifying workspace login and testing task updates).
Evaluating the Business Tradeoff
Audit logs confirmed reps completed the software checklist for 20 out of 20 pilot requests, and a spot-check of 5 setups verified that user accounts were correctly matched.
The pilot presented a clear operational tradeoff: average cycle time fell from 16 to 9 hours, but required 75 minutes of additional checking from Customer Success (resulting in a net company labor increase of 60 minutes per setup).
Because Customer Success had sufficient existing capacity to absorb its 75 minutes of added verification work without hiring extra staff, the process owner determined that reducing average cycle time from sixteen to nine hours justified the additional labor. The owner kept the redesigned process live while initiating a follow-up iteration of the to streamline the checklist—proving that BPM is an ongoing cycle of continuous improvement.
Look at Your Own Processes
To apply the BPM lifecycle to a workflow in your own organization, start with three simple questions:
-
Boundaries: Where does the customer’s request actually start, and what is the true final signal that they received usable value?
-
Handoffs: Which handoff between teams causes requests to sit idle or travel backward for clarification?
-
Tradeoffs: What change could reduce delay in your workflow, and what additional effort or risk would it introduce?
BPM Lifecycle Reference
This walkthrough follows the six-phase lifecycle described in Fundamentals of Business Process Management.
| Phase | Core Inputs | Primary Outputs | Key Focus |
|---|---|---|---|
| 1. Identification | Strategic goals & operational issues | Process architecture, boundaries, owner, & metrics | Scope, selection, & governance |
| 2. Discovery | Stakeholder interviews, logs, & observation | As-Is Process Model | Mapping current operational reality |
| 3. Analysis | As-Is model & performance data | Prioritized issue list & quantified delays | Identifying root causes of waste |
| 4. Redesign | Issue list & performance targets | To-Be Process Model | Designing streamlined workflows |
| 5. Implementation | To-Be model & operational rules | Executable process, trained staff, & configured tools | Change management & IT setup |
| 6. Monitoring | Execution data & audit logs | Performance & conformance findings | Continuous evaluation & iteration |